JClass DesktopViews Chart3D

Our newly updated DesktopViews Chart3D software brings upgrades and improvements to the DesktopViews suite of components. If you currently have an active maintenance agreement with Quest, upgrade to our new and improved version for free.

Upgrade Now

JClass Chart3D
JClass Chart3D

What is JClass Chart 3D?

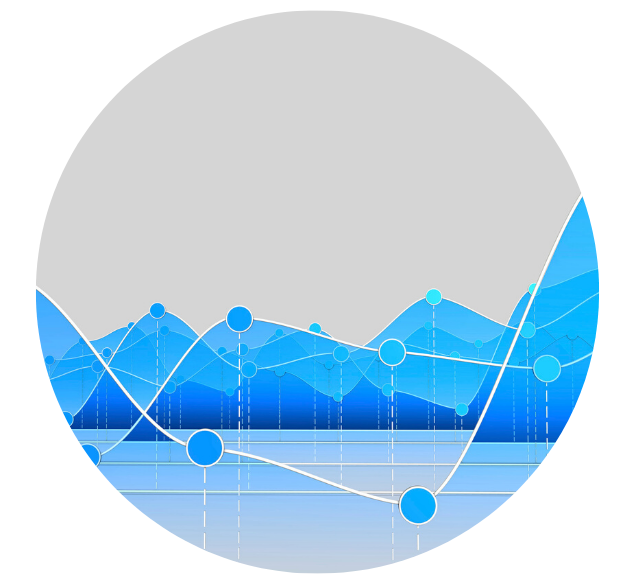
JClass Chart 3D is a powerful 3D charting tool written entirely in Java.  It allows developers to stunning 3D data views with interactive displays giving their application a professional look. JClass Chart 3D significantly improves decision making for users.
Learn More

Control How Your Data is Displayed

Display your data in a way that tells a story. With Chart3D, you can control how you want data displayed with customized chart types, such as surface, bar, or scatter plot. 
JClass Chart3D
Scout Solutions Logo

Need Help with Chart3D?

Contact Scout Solutions

Contact Scout Solutions – the JClass experts by calling us or writing us. Already a Quest JClass Customer? Request your free upgrade to continue support.

Upgrade Now

JClass Topics

Our blog discusses tips and tricks for using JClass software. Browse our JClass articles and learn how to get the most out of JClass. If you need further assistance, contact our JClass support team

JClass Chart3D Features

JClass Chart 3D allows you to control the following:

  • Chart type, such as surface, bar, or scatter plot
  • The positioning of the Header and Footer, including border style, text, font, and color
  • Very flexible data views from multiple sources, such as, files, URLs and databases
  • Chart styles for scatter plots, like line color and fill color. Also, control the point size, point style, and point color
  • Contour levels: you can use the default linear distribution or make/provide your own.
  • Contour styles: contour line styles and contour zones color are all customizable.
  • Plot cube scaling in x,y,z directions.
  • Position of the legend, such as orientation, border style, layout style, anchor, font, and color
  • Chart positioning: border style, color, width, height, and axes rotation
  • Axis labeling using Data labels, Value labels or pre-compiled values
  • X, Y, and Z axes, with each having its unique minimum, maximum, grid lines, font, and title
  • Control of how the user interacts with components, such as picking, mapping, Chart 3D Customizer, rotation, scaling, and translation
  • The ability to add a 4th dimension to the data using color
  • 3D rotation and perspective

Upgrade Now

Download Programming Manual

Download Manual